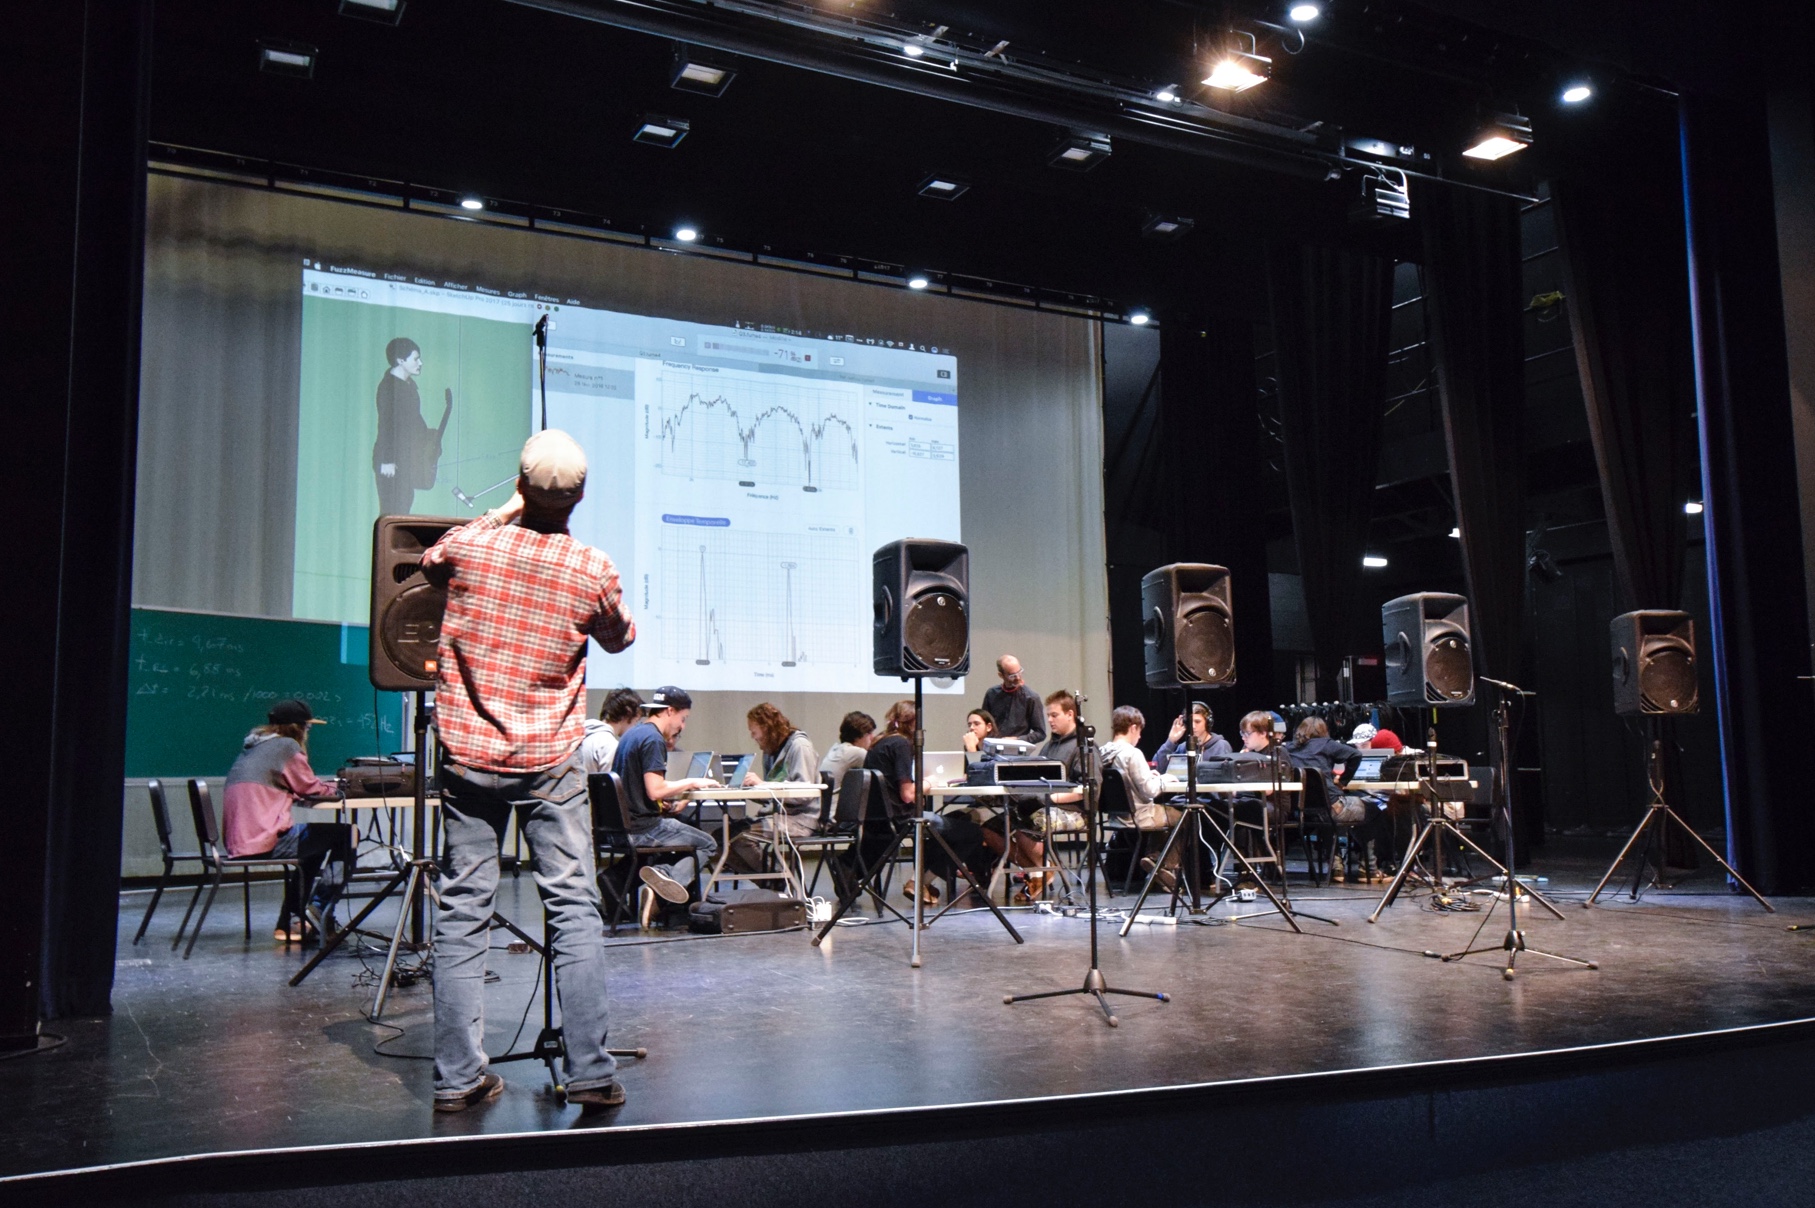
We're thrilled that FuzzMeasure is used in your classroom. What led you to this decision?
Acoustic measurement and analysis is abstract to most people; so as teachers we need tools that are as obvious and straightforward as possible. FuzzMeasure fits in because its simple and clear to use. It's easy to compare measurements and clearly isolate acoustic phenomena.
Also, it’s great that each student can turn in a document containing all their measurements, with markers in the graphs, and comments. And I especially like the time stamps on the measurements!
Could you describe some of the topics covered in your classroom?
We generally begin with verifying speakers’ time alignment with the Delay measurement then look at room resonances by correlating the Frequency Response, Rev Time and Waterfall graphs.
Then we use official reference documents to verify compliance. For instance, EBU Tech. 3276 provides guidelines for early reflections, reverberation time and operational room response curve in critical listening spaces. We follow this progression using FuzzMeasure’s Envelope Time Curve, Rev time, and Frequency Response analysis.
Along the way, we look at acoustics fundamentals relating to each of the measured criteria. For instance, said speaker time alignment involves speed of sound versus distance, and resonances involve wavelength, and room proportions. We use the Export to CSV feature for further analysis like auto verification of compliance to tolerances (in Excel, Numbers and/or Google Sheet). I also like to use the Harmonic Distortion and Waterfall graphs to show the signal to noise ratio of students’ measurements.


